One of the features that might strike one as “missing” in MSBuild Sidekick is a debugger. While we have this feature in our road-map for the next release and are working at it, we believe that using the logged data is the easiest way of diagnosing problems in build scripts.
The debugger might sound as the definite way to find an issue in MSBuild script, but probably by reviewing the sequence of the targets and tasks in most cases you will have a better chance of identifying the issue (especially if code includes external imports). And here is the reasoning why – browsing the log will give you immediate picture of the order the targets were executed in (though one might choose to use pre-build visualization for the same purpose), and what targets/tasks were executed. In addition to this information, if the target/task was skipped or failed during the build, the reason for that is readily available. And since this build “picture” is available for analysis together with the build script source, the user may easily navigate between log events and their source.
In MSBuild Sidekick v2 the logged data is available in several flavours – as console log, warnings/errors only log and detailed log. The console log is similar to MSBuild engine command-line output (including coloring of the text):
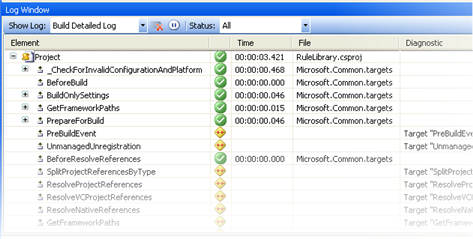
The detailed build log is a custom logger we have created, and its objective is to make all information available (as mentioned above) in a way that is easy to view and analyze. To illustrate this, let’s look at the detailed log output for typical C# project:
The log shows the collapsed list of targets executed in the order of execution; expanding collapsed target nodes displays all tasks executed in the target. For every target/task the following information is available:
-
Element name
-
Execution status (Succeeded, Failed or Skipped)
-
Element execution time
-
MSBuild project file the element is defined in
-
Diagnostic message
Now, the most important of those are status and diagnostic columns. Let’s suppose that you have written custom script and your target is not executed during the run. Then, using the detailed log the target will be readily identified as skipped or failed, and the diagnostic message will contain the status specific reason. The message can be used to immediately identify the reason; for example, in the screenshot below PreBuildEvent target was skipped due to the condition evaluated to false, more specifically property $(PreBuildEvent) value being empty:
Double-clicking the target/task in the log will immediately jump to the element in the project tree, thus allowing the user to review the element definitions.
In order to increase the relevancy of data in the log, the output can be filtered by the status of targets/tasks (for example, showing only skipped tasks):
If the build script imports several files, the target source is readily available in File column. For stock C# project, one can see the targets defined in Common and C# specific imports:
Altogether, our belief is that the detailed log is a convenient tool to identify and fix issues in build scripts both during the ongoing development and maintenance thereafter; and it is fairly obvious how to use it for the purpose. While the detailed logger can be created as a stand-alone component (see Jonh Robbins’ blog for an example of one), together with the view of the project source and navigation abilities between log and the source, in MSBuild Sidekick detailed log information is sufficient to diagnose and solve most problems.


