We are happy to announce release of MSBuild Sidekick v4.5.1. The version is updated to work with Visual Studio 2013 and .NET 4.5.1.
January 2, 2014
| MSBuild Sidekick v4.5.1 is available! | ||||
|
|
||||
March 22, 2010
| MSBuild Sidekick v3 is updated for RC | ||||
|
MSBuild Sidekick v3 Beta is updated to work with .NET 4.0 RC. Get it here! |
||||
February 6, 2010
| Debugging Team Build with MSBuild Sidekick | ||||
|
MSBuild is powerful general purpose build engine, but what if you have a dedicated build server running Team Foundation Server Build? Did you know that you can execute Team Build projects locally and even debug them with MSBuild Sidekick? In this post we shall show how to do that in three simple steps (for Visual Studio Team Foundation Server 2008). Prior to debugging you need to know about several limitations desktop build has comparing to Team build running on the server. From MSDN article "How to: Build Team Projects on a Desktop":
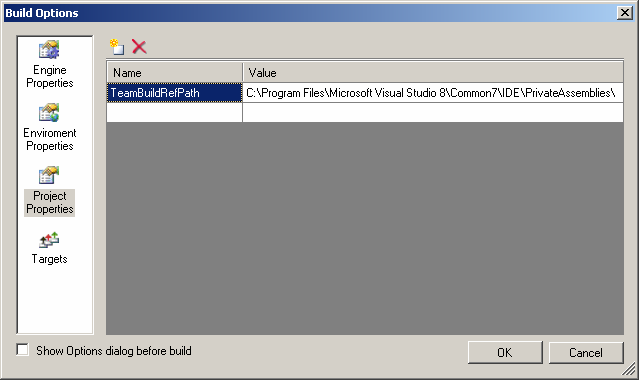
1. Follow the directions in the article to get you all prerequisites for building Team Build projects locally in order. 2. Open local copy of Team Build project file from previous step with MSBuild Sidekick and define TeamBuildRefPath property in "Project Properties" pane. To do so access "Build" -> "Build Options" menu item, and then click "Project Properties" icon at the left pane and add TeamBuildRefPath property with its value set to "C:\Program Files\Microsoft Visual Studio 8\Common7\IDE\PrivateAssemblies\" (or different drive where you have VS 2008 installed).
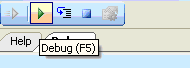
Reload project by clicking "File" -> "Reload". A few warnings you still see do not affect further debugging. 3. Your Team Build project is now ready for debugging. You may start debugging by clicking Debug toolbar button or pressing F5 key.
You can learn more about debugging and how to use it efficiently from our previous posts “How to debug step-by-step with MSBuild Sidekick” and “How to review Properties & Items while debugging with MSBuild Sidekick”. |
||||
January 27, 2010
| MSBuild Sidekick v3 Beta is available! | ||||
|
We are happy to announce a release of MSBuild Sidekick v3, supporting full range of MSBuild versions from 2.0 to 4.0. Using v3, you will be able to experiment with new MSBuild features available in .Net 4.0 Beta 2 and Visual Studio 2010 Beta 2. Download and try this new version right now! You don’t need to uninstall previous MSBuild Sidekick version, and no license is required for the beta (the beta expires on 01 May 2010). Runtime .Net 4.0 Beta 2 is required. It’d be great if you email us about your user experience, found bugs and new feature requests. Final version MSBuild Sidekick v3 will be released after Visual Studio 2010 RTM. |
||||
May 15, 2009
| How to review Properties & Items while debugging with MSBuild Sidekick | ||||
|
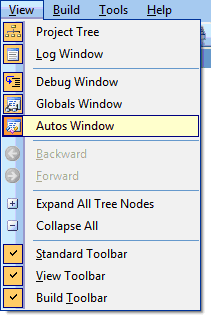
In the recent post we described the basics of debugging typical MSBuild project. In this post we shall touch upon important feature of MSBuild Sidekick debugger – namely inspecting Property and Item values during debugging with Globals and Autos windows. The walkthrough below will show how to review Property and Item values while debugging: 1. Start debugging project in step-by-step mode (see previous post) 2. When Target/Task is selected (highlighted with bold border in Debug window) click on View > Globals Window and View > Autos Window menu.
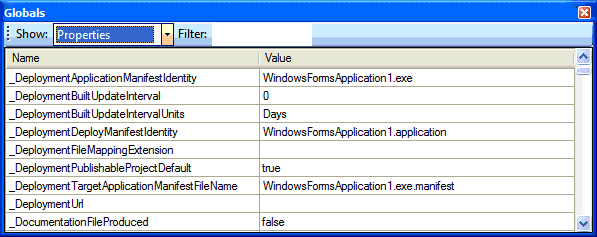
Globals and Autos windows will appear at bottom pane of main application window. Globals window displays Property and Item values as they are evaluated during the build execution.
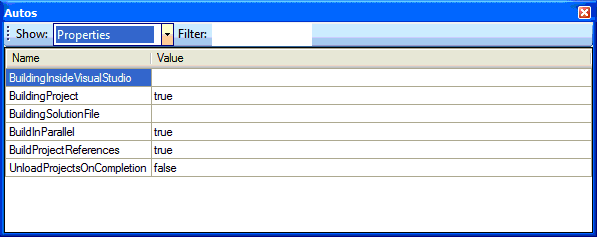
Autos window is similar to Globals window but displays only Properties/Items that are defined as input or output parameters for Target/Task element to be executed at the next step as you step through the project.
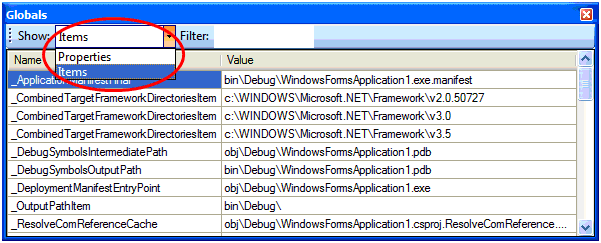
3. Now let’s review the data. One can use Show combo box to switch between Properties and Items view mode.
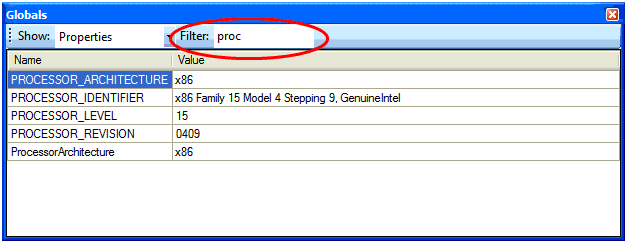
4. You may also use Filter text box to filter currently visible elements based on element name.
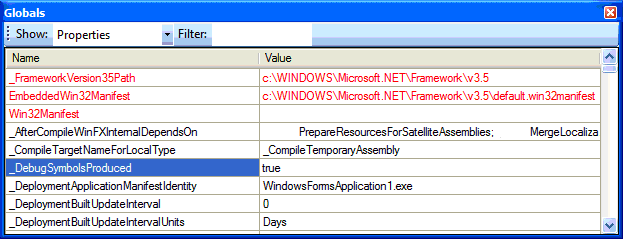
5. As you click on "Debug Step" button and debug step-by-step you may see that Properties/Items that have been changed on previous step are highlighted in red.
|
||||
April 22, 2009
| How to debug step-by-step with MSBuild Sidekick | ||||
|
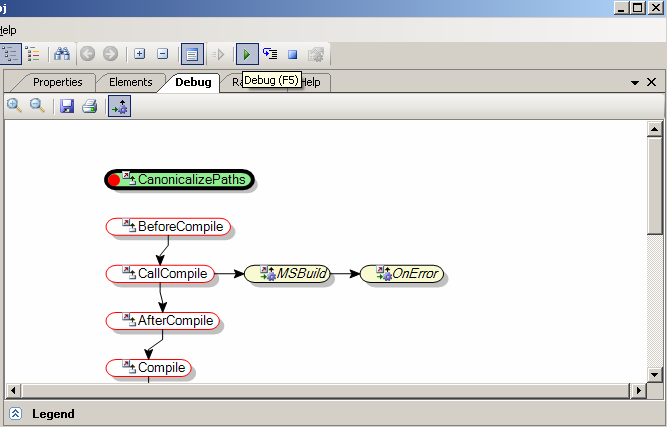
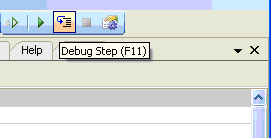
Have you ever tried to debug MSBuild project? If you did, in all probability you had to resort to introducing extra Message tasks into the project to output status during project execution; and then execute build and review the logs time after time to identify the problems (perhaps adding more Message tasks as you proceed). Now you can debug your projects without ever adding extra "Message" tasks while reviewing build execution in real time – jut use MSBuild Sidekick debugger and resolve problems in your builds in no time. In this post we shall show how to debug typical C# console project with MSBuild Sidekick. 1. Create new C# Console Application project with Visual Studio and open the project with MSBuild Sidekick. 2. Click Debug Step button (or press F11 key) to start step-by-step debug.
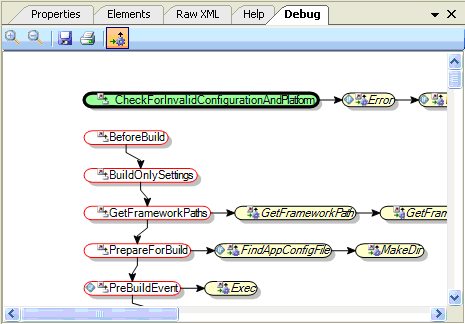
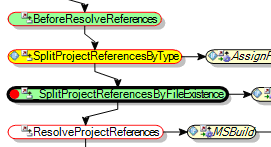
3. You can see now build execution order in Debug Window that should appear automatically. You may also open Debug Window by clicking on View -> Debug Window menu item.
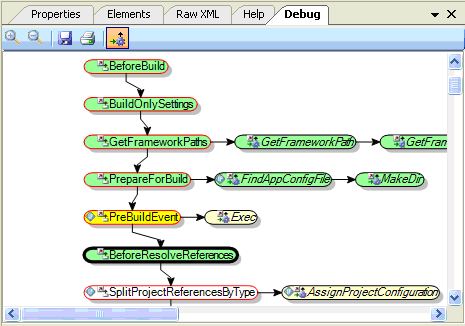
4. Once in Debug mode, you can debug step-by-step by clicking Debug Step button (or pressing F11 key). MSBuild Sidekick highlights diagram elements differently depending on their current status:
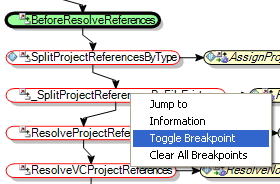
5. To stop build execution on a specific Target\Task you may set breakpoint on it. To set breakpoint for Target\Task open right-click context menu and choose Toggle Breakpoint item.
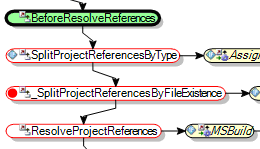
6. Target\Task with breakpoint becomes marked with red circle.
7. Click Debug button (or press F5 key) to continue debugging.
8. Once build execution reaches Target\Task with breakpoint set, MSBuild Sidekick will switch into step-by-step debug mode. Current Target/Task will be highlighted with bold border around it in Debug window.
|
||||
April 8, 2009
| How to use MSBuild Extension Pack tasks with MSBuild Sidekick | ||||
|
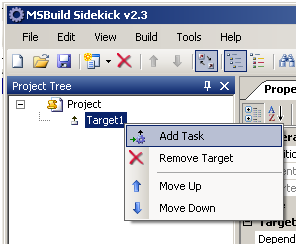
One of the most exciting and widely accepted projects in MSBuild community is MSBuild Extension Pack tasks. MSBuild Extension pack provides a collection of over 240 MSBuild tasks you may use in your MSBuild projects for free! In MSBuild Sidekick v 2.3 we introduced integration with MSBuild Extension Pack tasks; now you can add, edit properties and view online help for all the MSBuild Extension Pack tasks in the Sidekick application. To illustrate these features let’s create new MSBuild project in MSBuild Sidekick v2.3 and add a MSBuild Extension Pack task to it. Note: you should have MSBuild Extension Pack properly installed; it is available at http://www.codeplex.com/MSBuildExtensionPack. 1. Right click on Target element and choose "Add Task" from context menu.
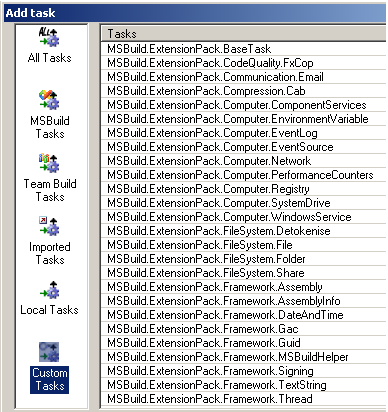
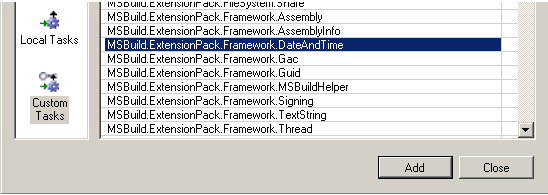
2. In the "Add Task" dialog choose "Custom Tasks" tab – you should see there all the MSBuild Extension Pack task classes.
3. Then click on task class you’re going to use in your project, click "Add" button and click "Close" to leave dialog window.
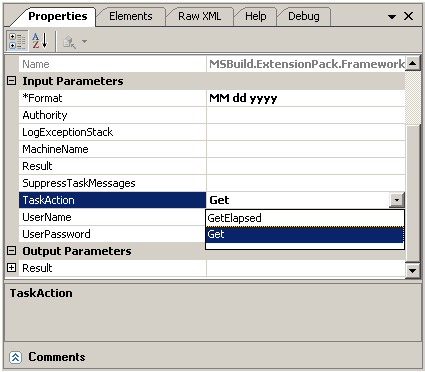
4. Choose relevant task action in TaskAction property drop-down for your new task.
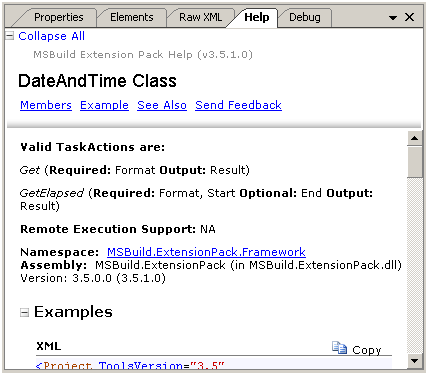
5. Once task action is selected, the task parameters list will be filtered automatically, so that only task parameters relevant for the selected task action will be displayed. Required input parameters will be marked with asterisk (see Format parameter on the screenshot above). 6. To view online help for the selected MSBuild Extension Pack task navigate to Help window.
|
||||
March 14, 2009
| MSBuild Sidekick v 2.3 is released | ||||
|
We are happy to announce the release of version 2.3 of MSBuild Sidekick! Many of you would remember “How would you spend $100 on MSBuild?” poll published on MSBuild Team Blog. MSBuild users were asked to vote on most valuable future features in MSBuild; and while we could not improve MSBuild engine performance or add inline tasks support we did implement visual debugger for MSBuild! MSBuild Sidekick v2.3 is now the one-stop solution for all your debugging needs such as stepping through the build, inspecting locals and setting breakpoints. The new features in MSBuild Sidekick v2.3 are:
Please note, that for all registered users the upgrade to new version is free of charge; otherwise the license can be purchased online. Please see product page for additional information; also make sure to have a look at walkthroughs detailing the application usage and the user manual. |
||||
February 14, 2008
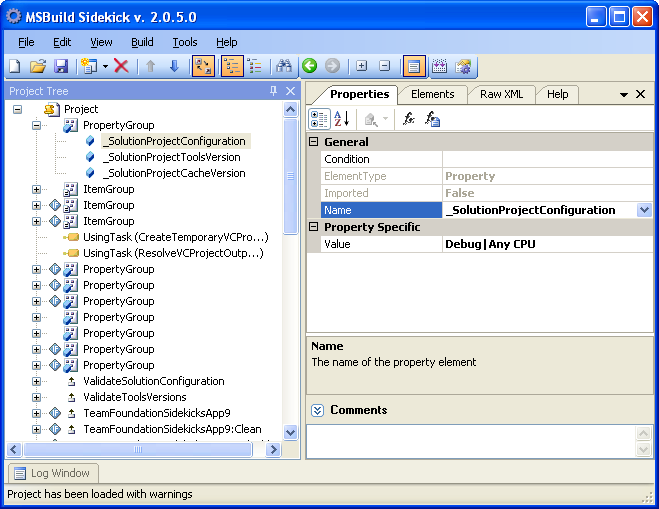
| Building Visual Studio solutions with MSBuild Sidekick | ||||
|
What do you do in Visual Studio when you need to develop several related modules at the same time? Probably you’d create a solution to specify the references between related projects (or at the very least, make loading and debugging related projects easier). The interesting fact is while solution files are the main Visual Studio vehicle for building sets of projects, they have a proprietary format, not compliant with MSBuild. So one might wonder – how is it then possible to build solutions from command line (msbuild solution1.sln)? How does the solution get built? It turns out that in order to build the solution, MSBuild engine transforms it on-the-fly from proprietary format into MSBuild script, with the projects build order organized according to inter-project dependencies; the resulting script also reflects all configurations available in the solution. For every project in the solution, there are four targets in the temporary MSBuild script – Build, Rebuild, Clean and Publish, corresponding to four operations on the solution supported by Visual Studio. In VS2005 (and MSBuild 2.0) one may modify somewhat obscure environment variable (msbuildemitsolution) to make sure that the generated script is not deleted after the build and thus available for tweaking; in VS2008 (MSBuild 3.5) the generated script is not deleted from the file system for your convinience. Now, why would one ever bother dealing with those generated scripts, and how MSBuild Sidekick can help you with that? Two typical scenarios come to mind. First scenario would be investigating why solution build fails when building solution from command line (as opposed to Visual Studio IDE builds) – common problem in transition from development environment to build server. Working with script really helps in narrowing down problematic projects/references. Second scenario would be creating custom project builds – generated solution scripts may serve as a base scripts for that purpose. MSBuild Sidekick lets you handle solution files as if they were in MSBuild format. You can open solution file in the Sidekick, and it will generate the MSBuild script for you and open it for viewing or editing and saving.
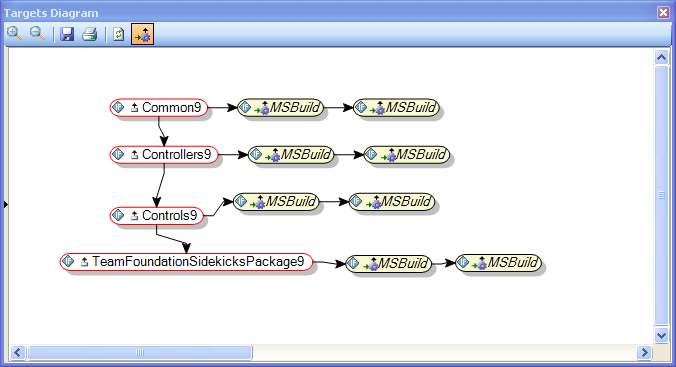
Moreover, viewing the dependencies between projects in solution file becomes a breeze with target visualization:
And of course, last but not least, you can actually build the solution script in MSBuild Sidekick. With those features, dealing with solutions becomes as routine task as working with any MSBuild project. |
||||
February 5, 2008
| How to fix problems in MSBuild script – log is the way to go! | ||||
|
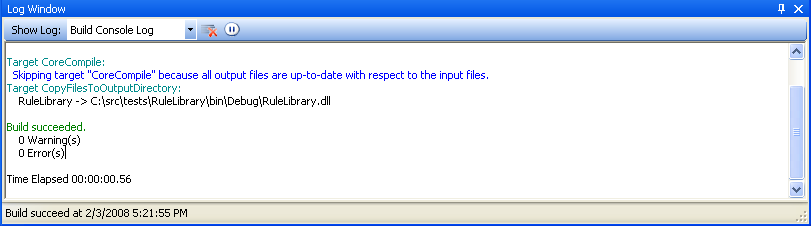
One of the features that might strike one as “missing” in MSBuild Sidekick is a debugger. While we have this feature in our road-map for the next release and are working at it, we believe that using the logged data is the easiest way of diagnosing problems in build scripts. The debugger might sound as the definite way to find an issue in MSBuild script, but probably by reviewing the sequence of the targets and tasks in most cases you will have a better chance of identifying the issue (especially if code includes external imports). And here is the reasoning why – browsing the log will give you immediate picture of the order the targets were executed in (though one might choose to use pre-build visualization for the same purpose), and what targets/tasks were executed. In addition to this information, if the target/task was skipped or failed during the build, the reason for that is readily available. And since this build “picture” is available for analysis together with the build script source, the user may easily navigate between log events and their source. In MSBuild Sidekick v2 the logged data is available in several flavours – as console log, warnings/errors only log and detailed log. The console log is similar to MSBuild engine command-line output (including coloring of the text):
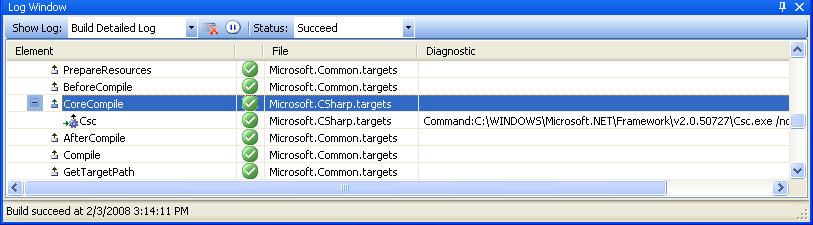
The detailed build log is a custom logger we have created, and its objective is to make all information available (as mentioned above) in a way that is easy to view and analyze. To illustrate this, let’s look at the detailed log output for typical C# project:
The log shows the collapsed list of targets executed in the order of execution; expanding collapsed target nodes displays all tasks executed in the target. For every target/task the following information is available:
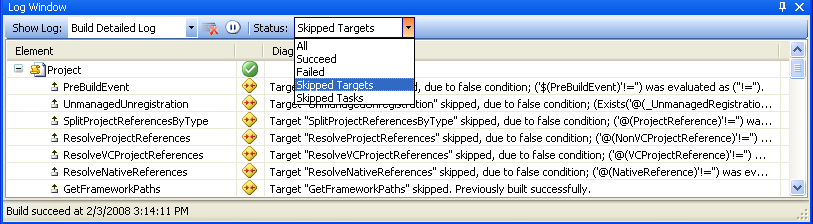
Now, the most important of those are status and diagnostic columns. Let’s suppose that you have written custom script and your target is not executed during the run. Then, using the detailed log the target will be readily identified as skipped or failed, and the diagnostic message will contain the status specific reason. The message can be used to immediately identify the reason; for example, in the screenshot below PreBuildEvent target was skipped due to the condition evaluated to false, more specifically property $(PreBuildEvent) value being empty:
Double-clicking the target/task in the log will immediately jump to the element in the project tree, thus allowing the user to review the element definitions. In order to increase the relevancy of data in the log, the output can be filtered by the status of targets/tasks (for example, showing only skipped tasks):
If the build script imports several files, the target source is readily available in File column. For stock C# project, one can see the targets defined in Common and C# specific imports:
Altogether, our belief is that the detailed log is a convenient tool to identify and fix issues in build scripts both during the ongoing development and maintenance thereafter; and it is fairly obvious how to use it for the purpose. While the detailed logger can be created as a stand-alone component (see Jonh Robbins’ blog for an example of one), together with the view of the project source and navigation abilities between log and the source, in MSBuild Sidekick detailed log information is sufficient to diagnose and solve most problems. |
||||